
Why it's different
Your world.
Your language.
One living model.
Shape a model around the problem you need to solve. Connect the information, explore it from different perspectives, and keep building on what you learn.
More than diagrams. Lighter than traditional EA tools.
For work that needs connected structure, without having to model everything first.
Information with relationships
A spreadsheet can be a useful starting point for lists and calculations.
When the question becomes “what depends on what?”, model the relationships alongside the information — and follow those connections.
Views backed by a model
A diagram can make an idea easier to explain.
In Planalyze, diagrams, charts, and catalogues draw on model data. Keep developing the information behind the view as your understanding changes.
Structure you can shape
An established framework can give you a useful vocabulary and approach.
Use what helps, adapt what needs to change, or define your own language. Build enough structure to address the problem in front of you.
A shared modelling language
Make the model fit your world.
Define the types of things that matter, the attributes that describe them, and the relationships between them. Together, these form your metamodel — the language people and AI use to build the model.
Start with a template, adapt an established approach, or develop your own. Combine business and technology concepts where the problem calls for it.
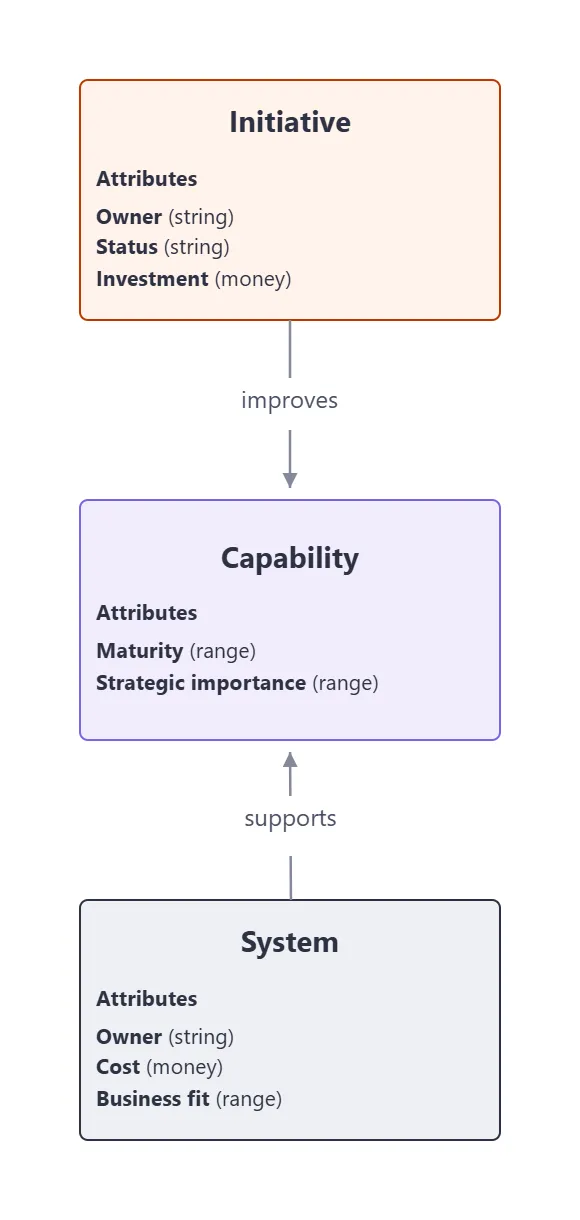
A metamodel created in Planalyze. You choose the concepts, attributes and relationships—this is one example, not a required framework. View full-size metamodel (opens a new tab)
What you might model · Business capabilities · Strategy · Application portfolios · Value streams · C4 · Risk and controls · and much more
One model, different perspectives
Change the view.
Keep the connection.
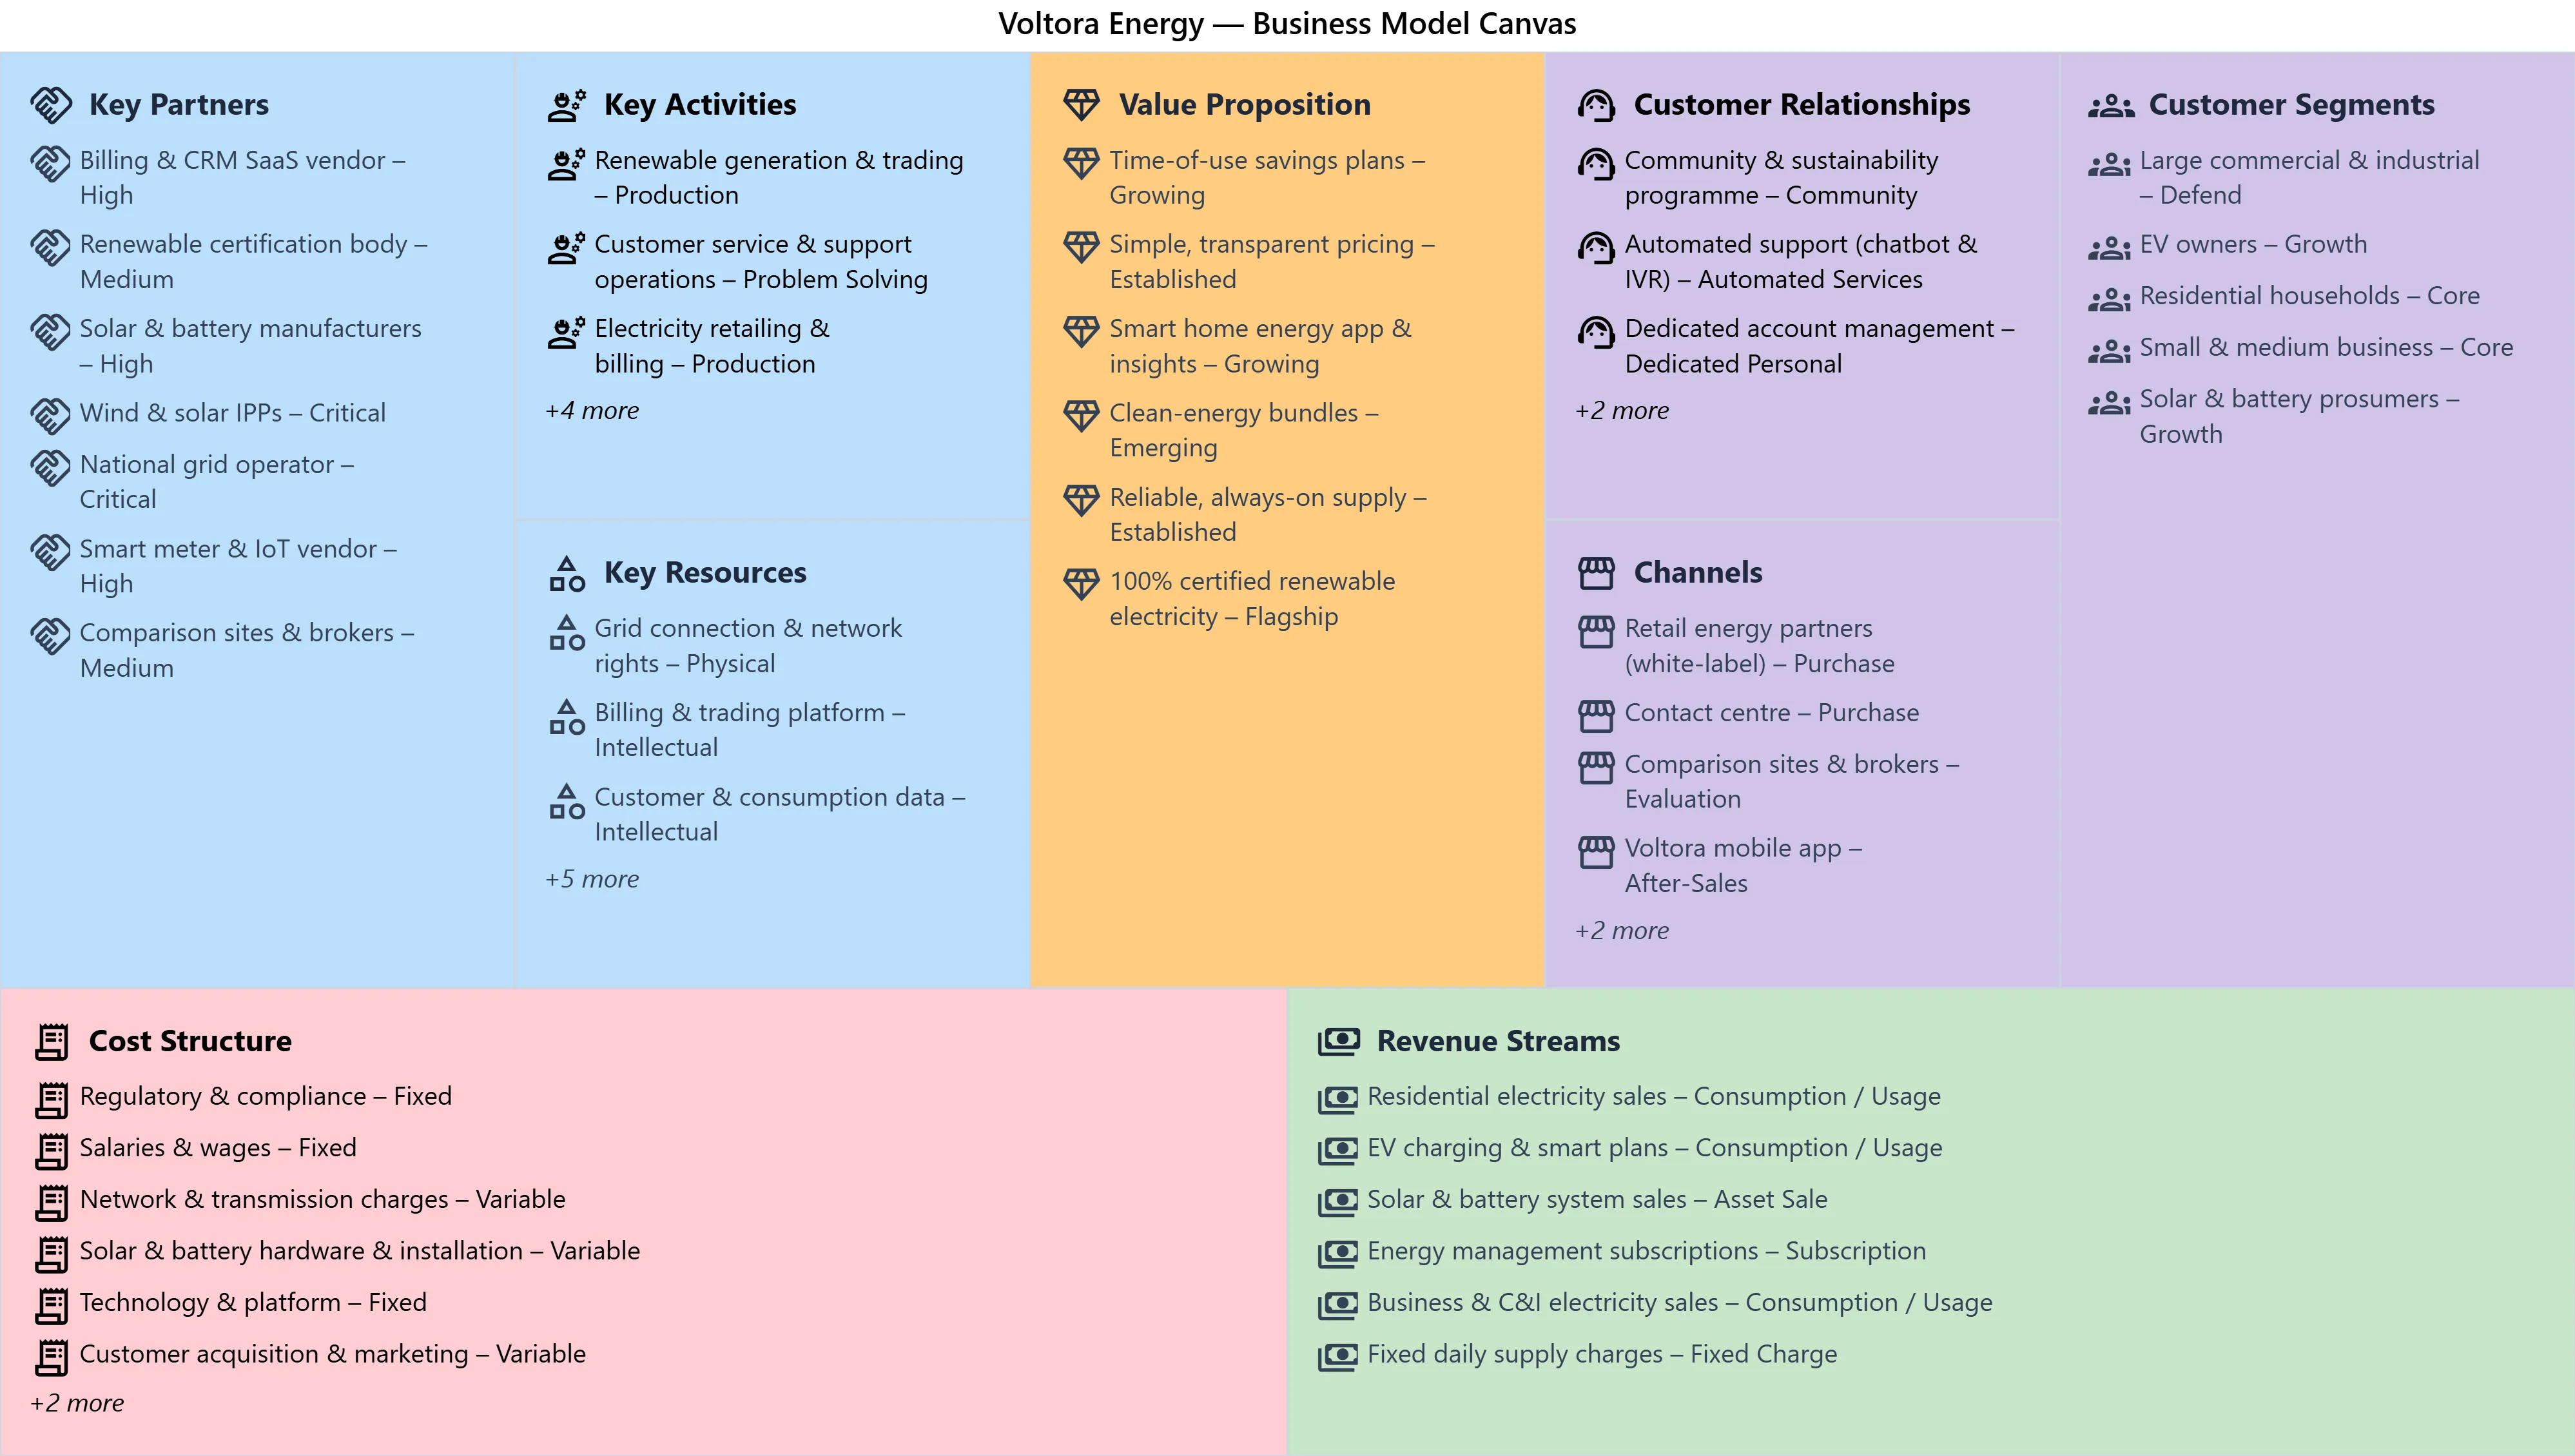
Use a familiar canvas to explain the business, a diagram to follow dependencies, a chart to compare options, or a catalogue to examine the detail. Each view draws on model data, so the information remains connected to the work behind it.
Bring the picture together
See partners, activities, value, customers, costs, and revenue in one coherent view.
Go behind the canvas
Open the model entries and use diagrams, charts, or catalogues to investigate what matters.
Use a familiar view
Present the model in a form your audience recognises, without separating it from the underlying information.
People + AI, one model
Keep the work.
Keep developing it.
An AI-generated snapshot can be a starting point. Planalyze gives people and AI a shared model to read, change, and return to as the work develops.
Bring in information from reports and spreadsheet data, explore an approach, build connections, and explain the findings. Work with the built-in assistant or connect a compatible external assistant through MCP.
Explore Planalyze + AIAI features are in beta. The built-in assistant uses your own provider key.
Bring a real-world problem.
Build a useful model around it. Connect what matters, explore the possibilities, and take the next decision with a clearer picture.