
See the whole picture
Important decisions. Scattered information.
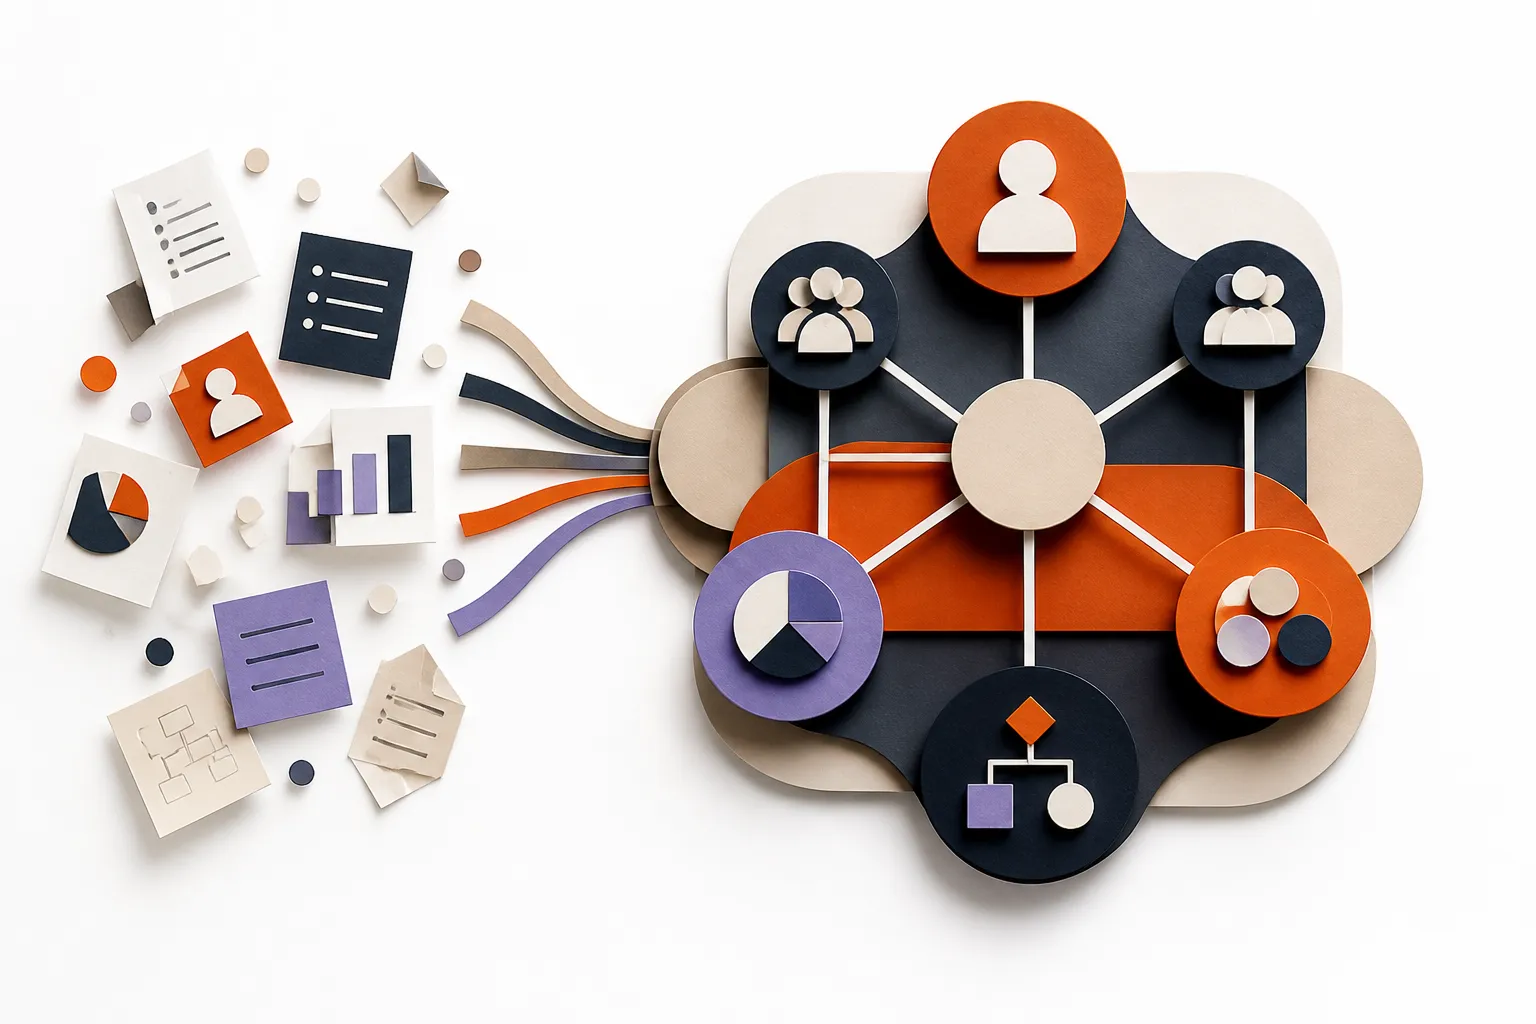
Spreadsheets, diagrams, documents, and people’s heads. Bring the pieces into one connected model — so you can understand what you have, what connects, and what change will mean.
For analysts, architects, strategists, planners, and people making change happen.
More than diagrams. Lighter than traditional EA tools.
Beta · AI assistant uses your own provider key.
The questions behind the work
The information exists.
The answer is harder to find.
- What do we actually have?
- What depends on what?
- What happens if we change something?
- Where are we duplicating cost or capability?
- Are our initiatives supporting our strategy?
- How do we explain the answer clearly?
Planalyze brings the relevant information into one connected model you can explore, analyse, and explain.
Start with value
Build what’s useful.
Then let it grow.
You don’t need to model your whole organisation. Start with the information that helps someone understand something or make a decision. Add detail as new questions require it.
Keep it yours
Your world doesn’t have to fit someone else’s framework.
Use your own language. Start with a template, adapt a familiar methodology, or ask AI to help structure an unfamiliar one. Keep what helps; change what doesn’t.
What you might model · Application portfolios · Business strategy · Value streams · C4 · Cloud architecture · and much more
Change the view. Keep the connection.
A diagram for dependencies. A chart for investment choices. A capability view for business priorities. Different ways to understand connected model data.
Diagrams, charts, and catalogues are live views of your model — not separate copies to keep in sync.
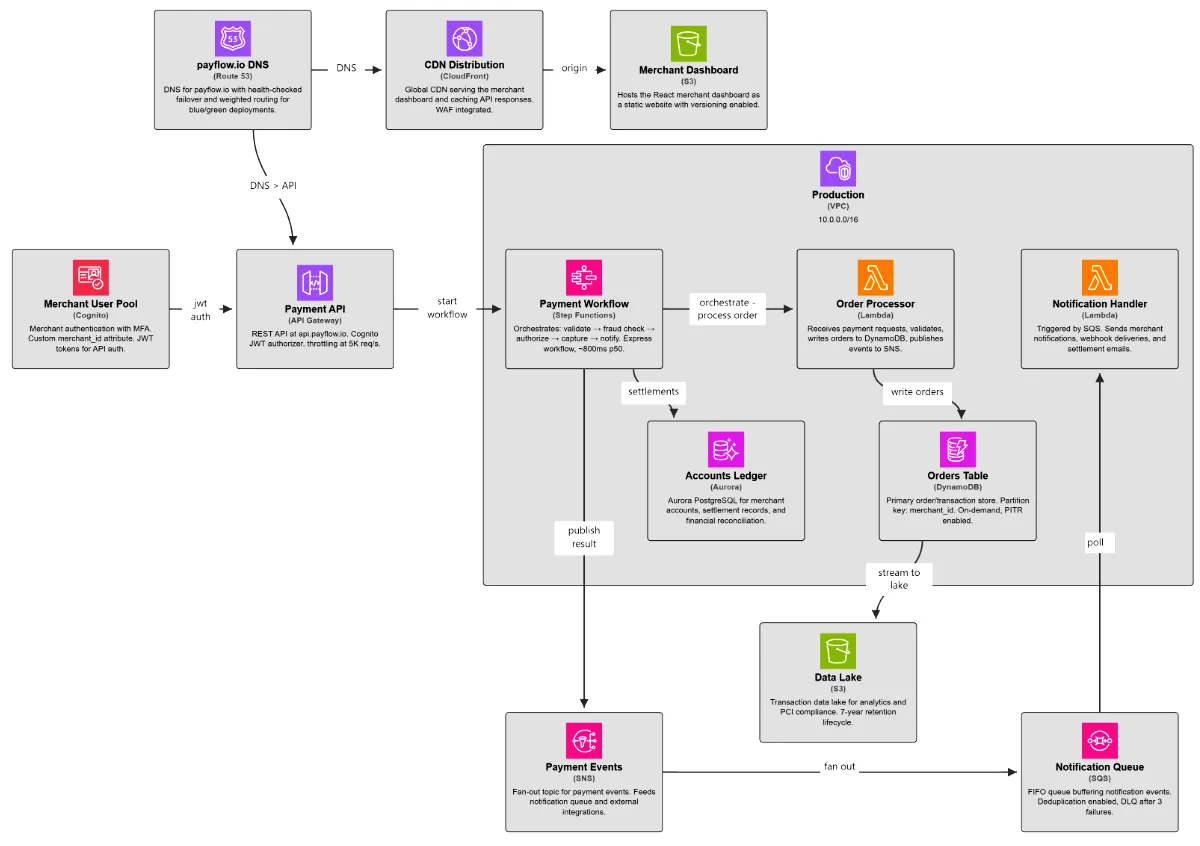
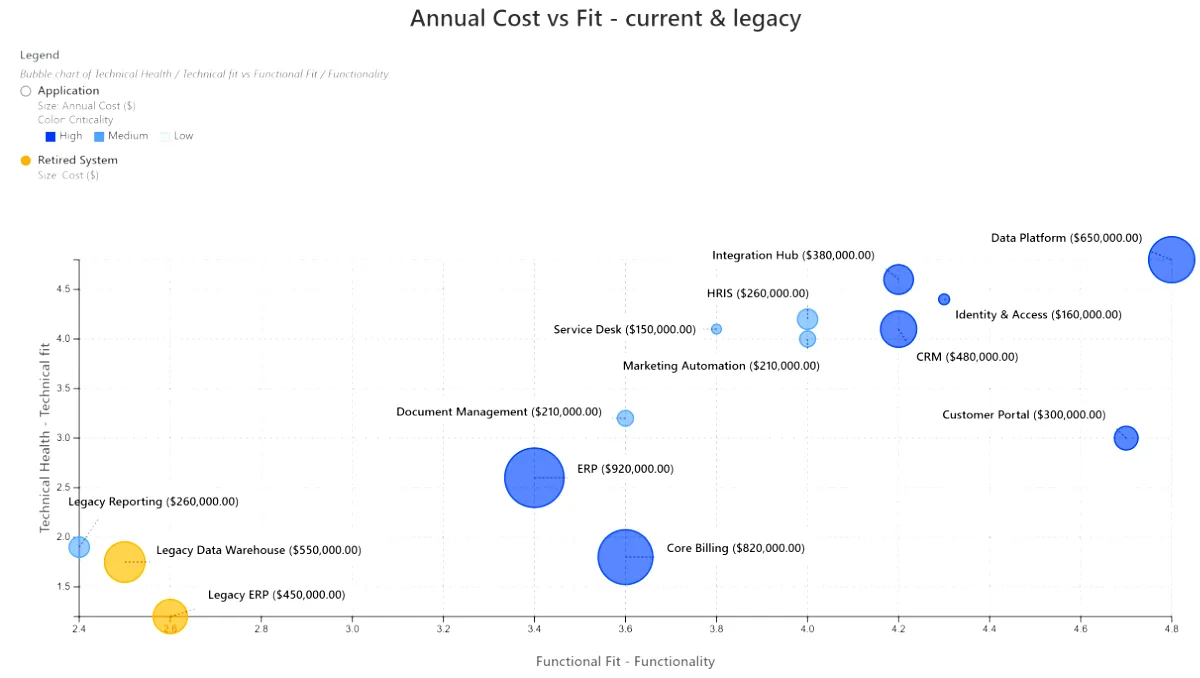
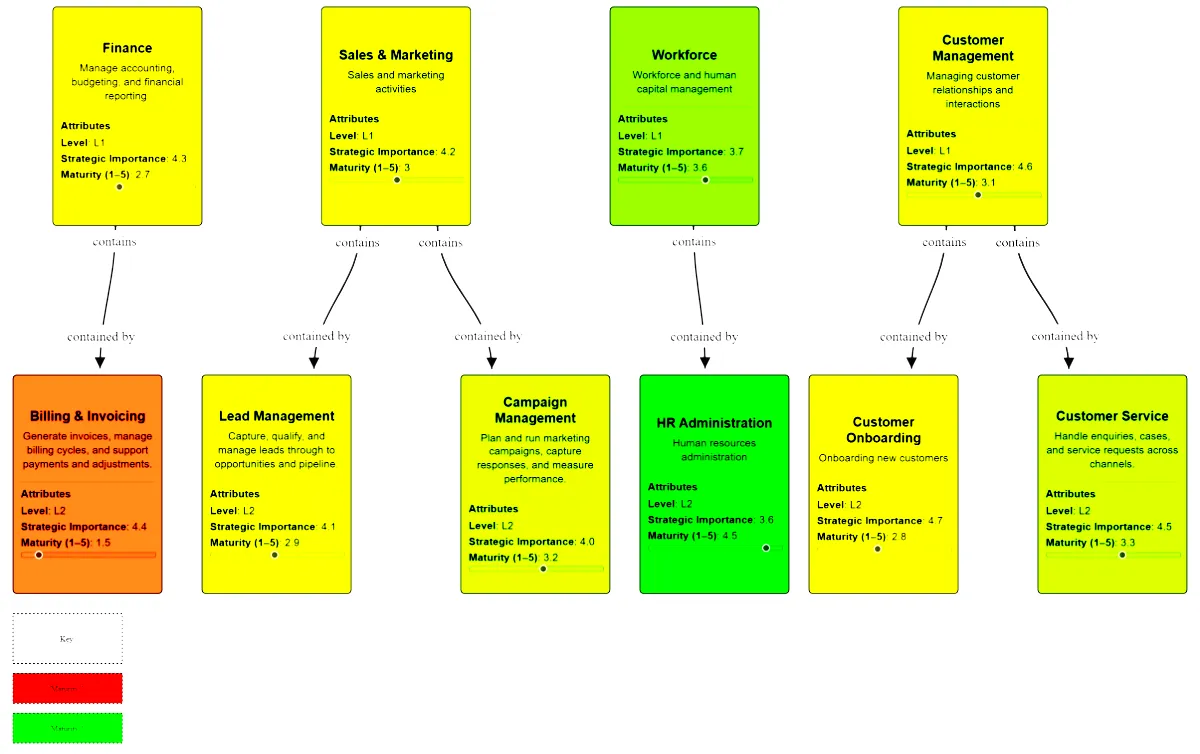
Product examples from different models, illustrating the views you can create.
Analyse
Learn from the model.
Explore dependencies, compare cost and fit, and spot gaps or duplication. Use what you learn to decide where to invest, simplify, or look more closely.
Communicate
Make the answer easier to understand.
Focus the view on what each audience needs: business priorities, executive decisions, or delivery detail. The model can be complex. The answer doesn’t have to be.
People + AI, throughout the work
A thinking partner.
A model you build together.
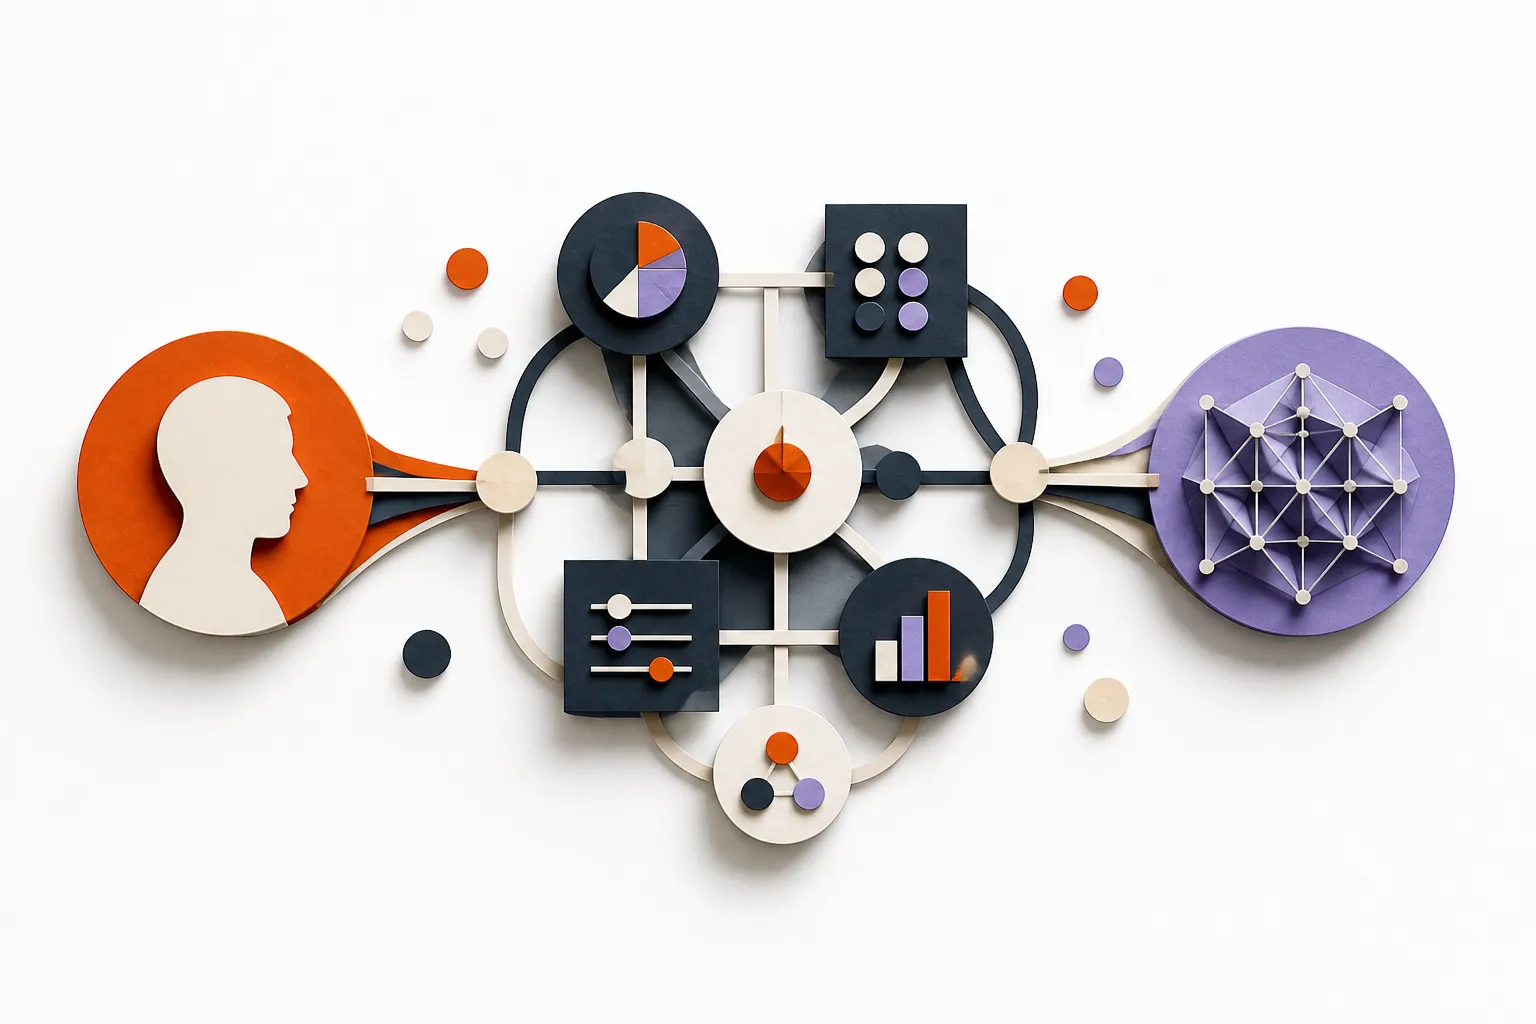
AI can help you find an approach, develop the model, explore what it means, and explain it to others. Your knowledge and judgement stay part of the work.
Expert
Explore an unfamiliar domain or approach with a thinking partner.
Guide
Find a useful starting point and decide what to model next.
Modeller
Turn ideas and information into a model you can build on.
Analyst
Explore connections, test assumptions, and understand the implications.
Communicator
Shape a clear story for the people who need to understand it.
Work with AI inside Planalyze or connect an external assistant to the same living model.
AI features are in beta. The built-in assistant uses your own provider key.
Explore Planalyze + AI →More than diagrams. Lighter than traditional EA tools.
For work that needs more connected structure than separate files can comfortably maintain — and a focused modelling environment your team can shape.
Start modelling what matters.
Bring a question. Build a useful model. Take the next decision with a clearer picture.