How it works
Model what matters.
Visualize what connects.
Planalyze turns scattered information into a connected model you can explore as diagrams, catalogs, and analysis views.
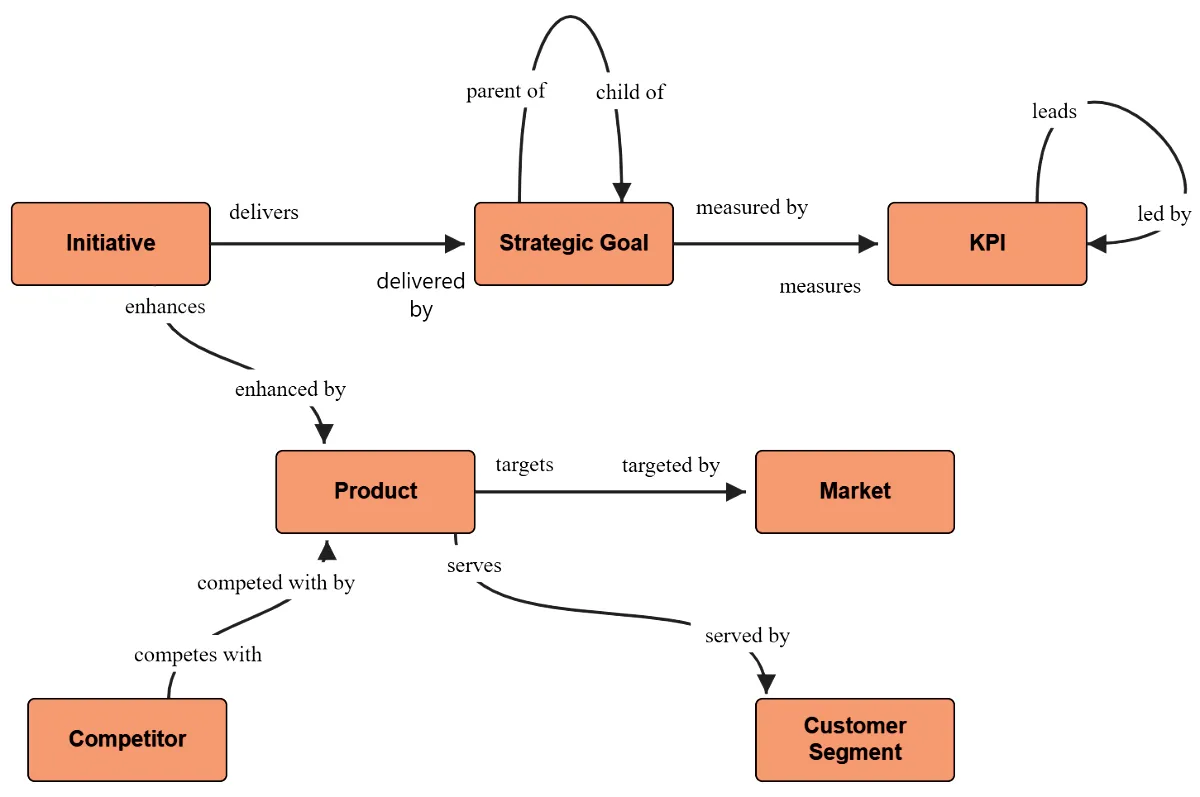
1. Define the structure
Start with the things that matter to your organization
Create types such as Applications, Capabilities, Products, Teams, or Risks. Add attributes that matter to you, then define the relationships between them.
- ✓Types define categories of things
- ✓Attributes capture the details
- ✓Relationships define how things connect
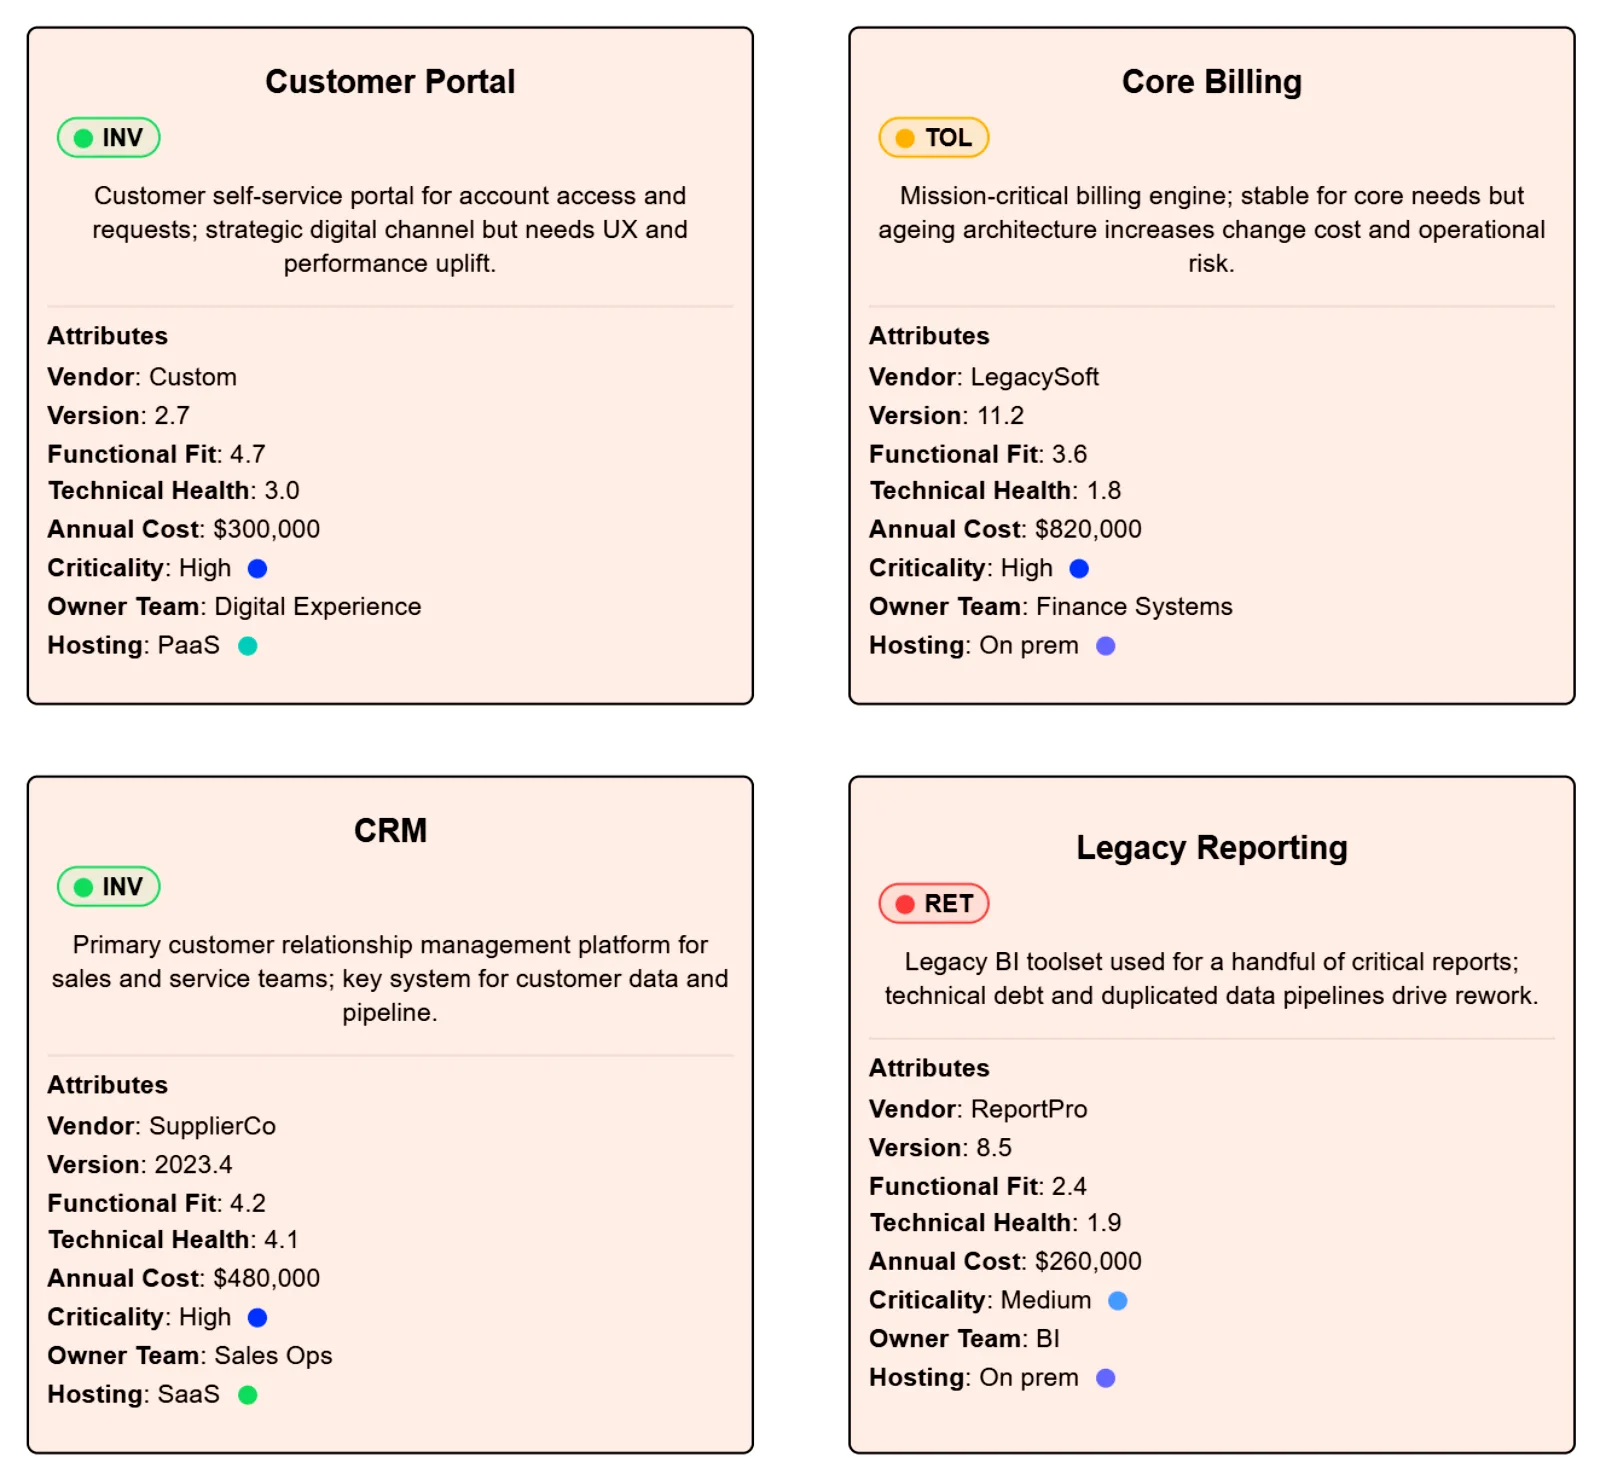
2. Add real-world data
Create the actual things you want to understand
Once the structure is in place, add real applications, business capabilities, products, initiatives, or any other instances that belong to those types.
- ✓Capture what exists today
- ✓Keep information connected
- ✓Build a shared source of truth
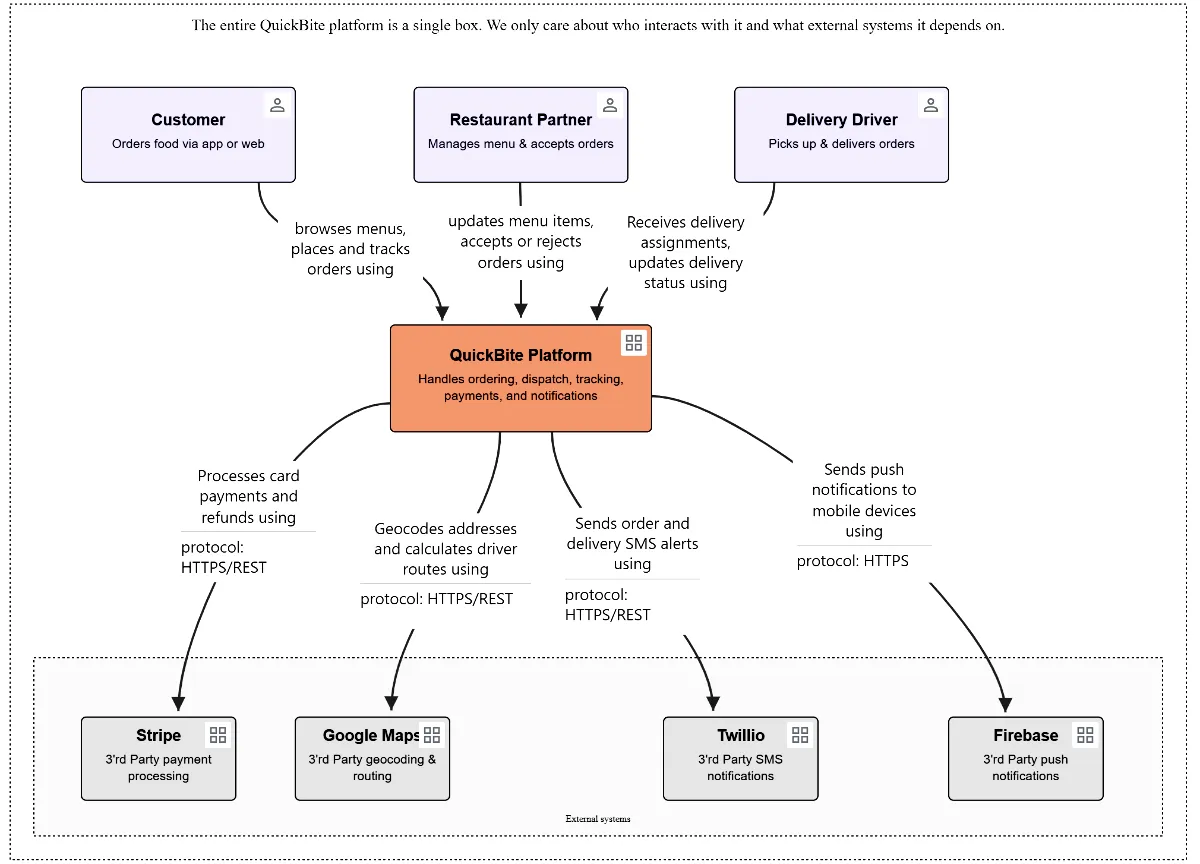
3. Visualize the model
Turn the same model into different views
Use diagrams to communicate structure and relationships clearly. The same underlying model can support high-level landscapes, detailed architectures, or business views.
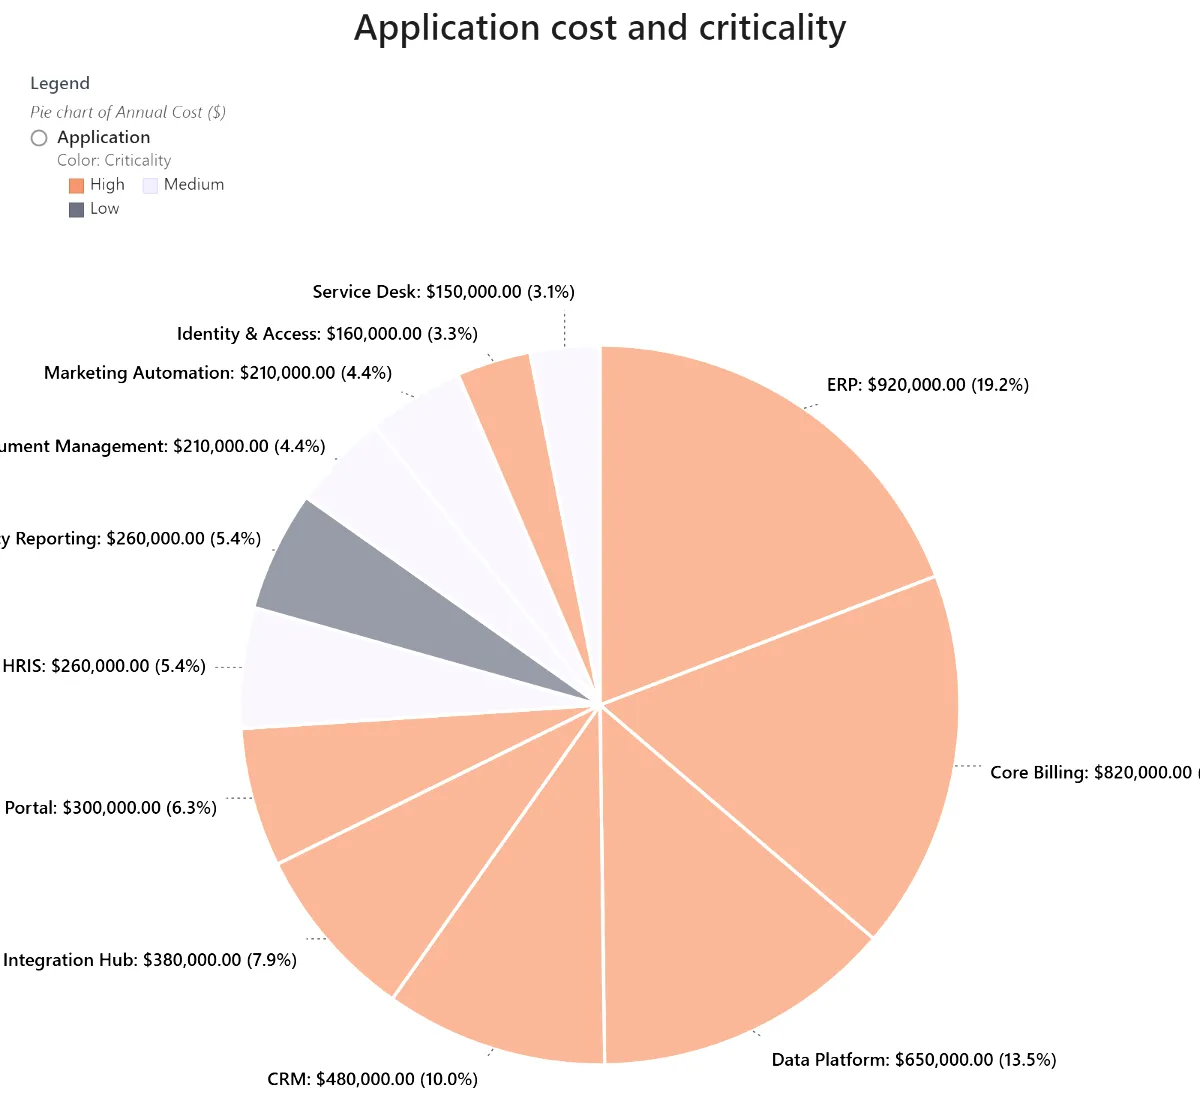
4. Analyse and act
Move from pictures to decisions
Because the model is structured, you can chart, compare, and analyze it. See cost, criticality, maturity, fit, or any other attributes that matter to your decisions.
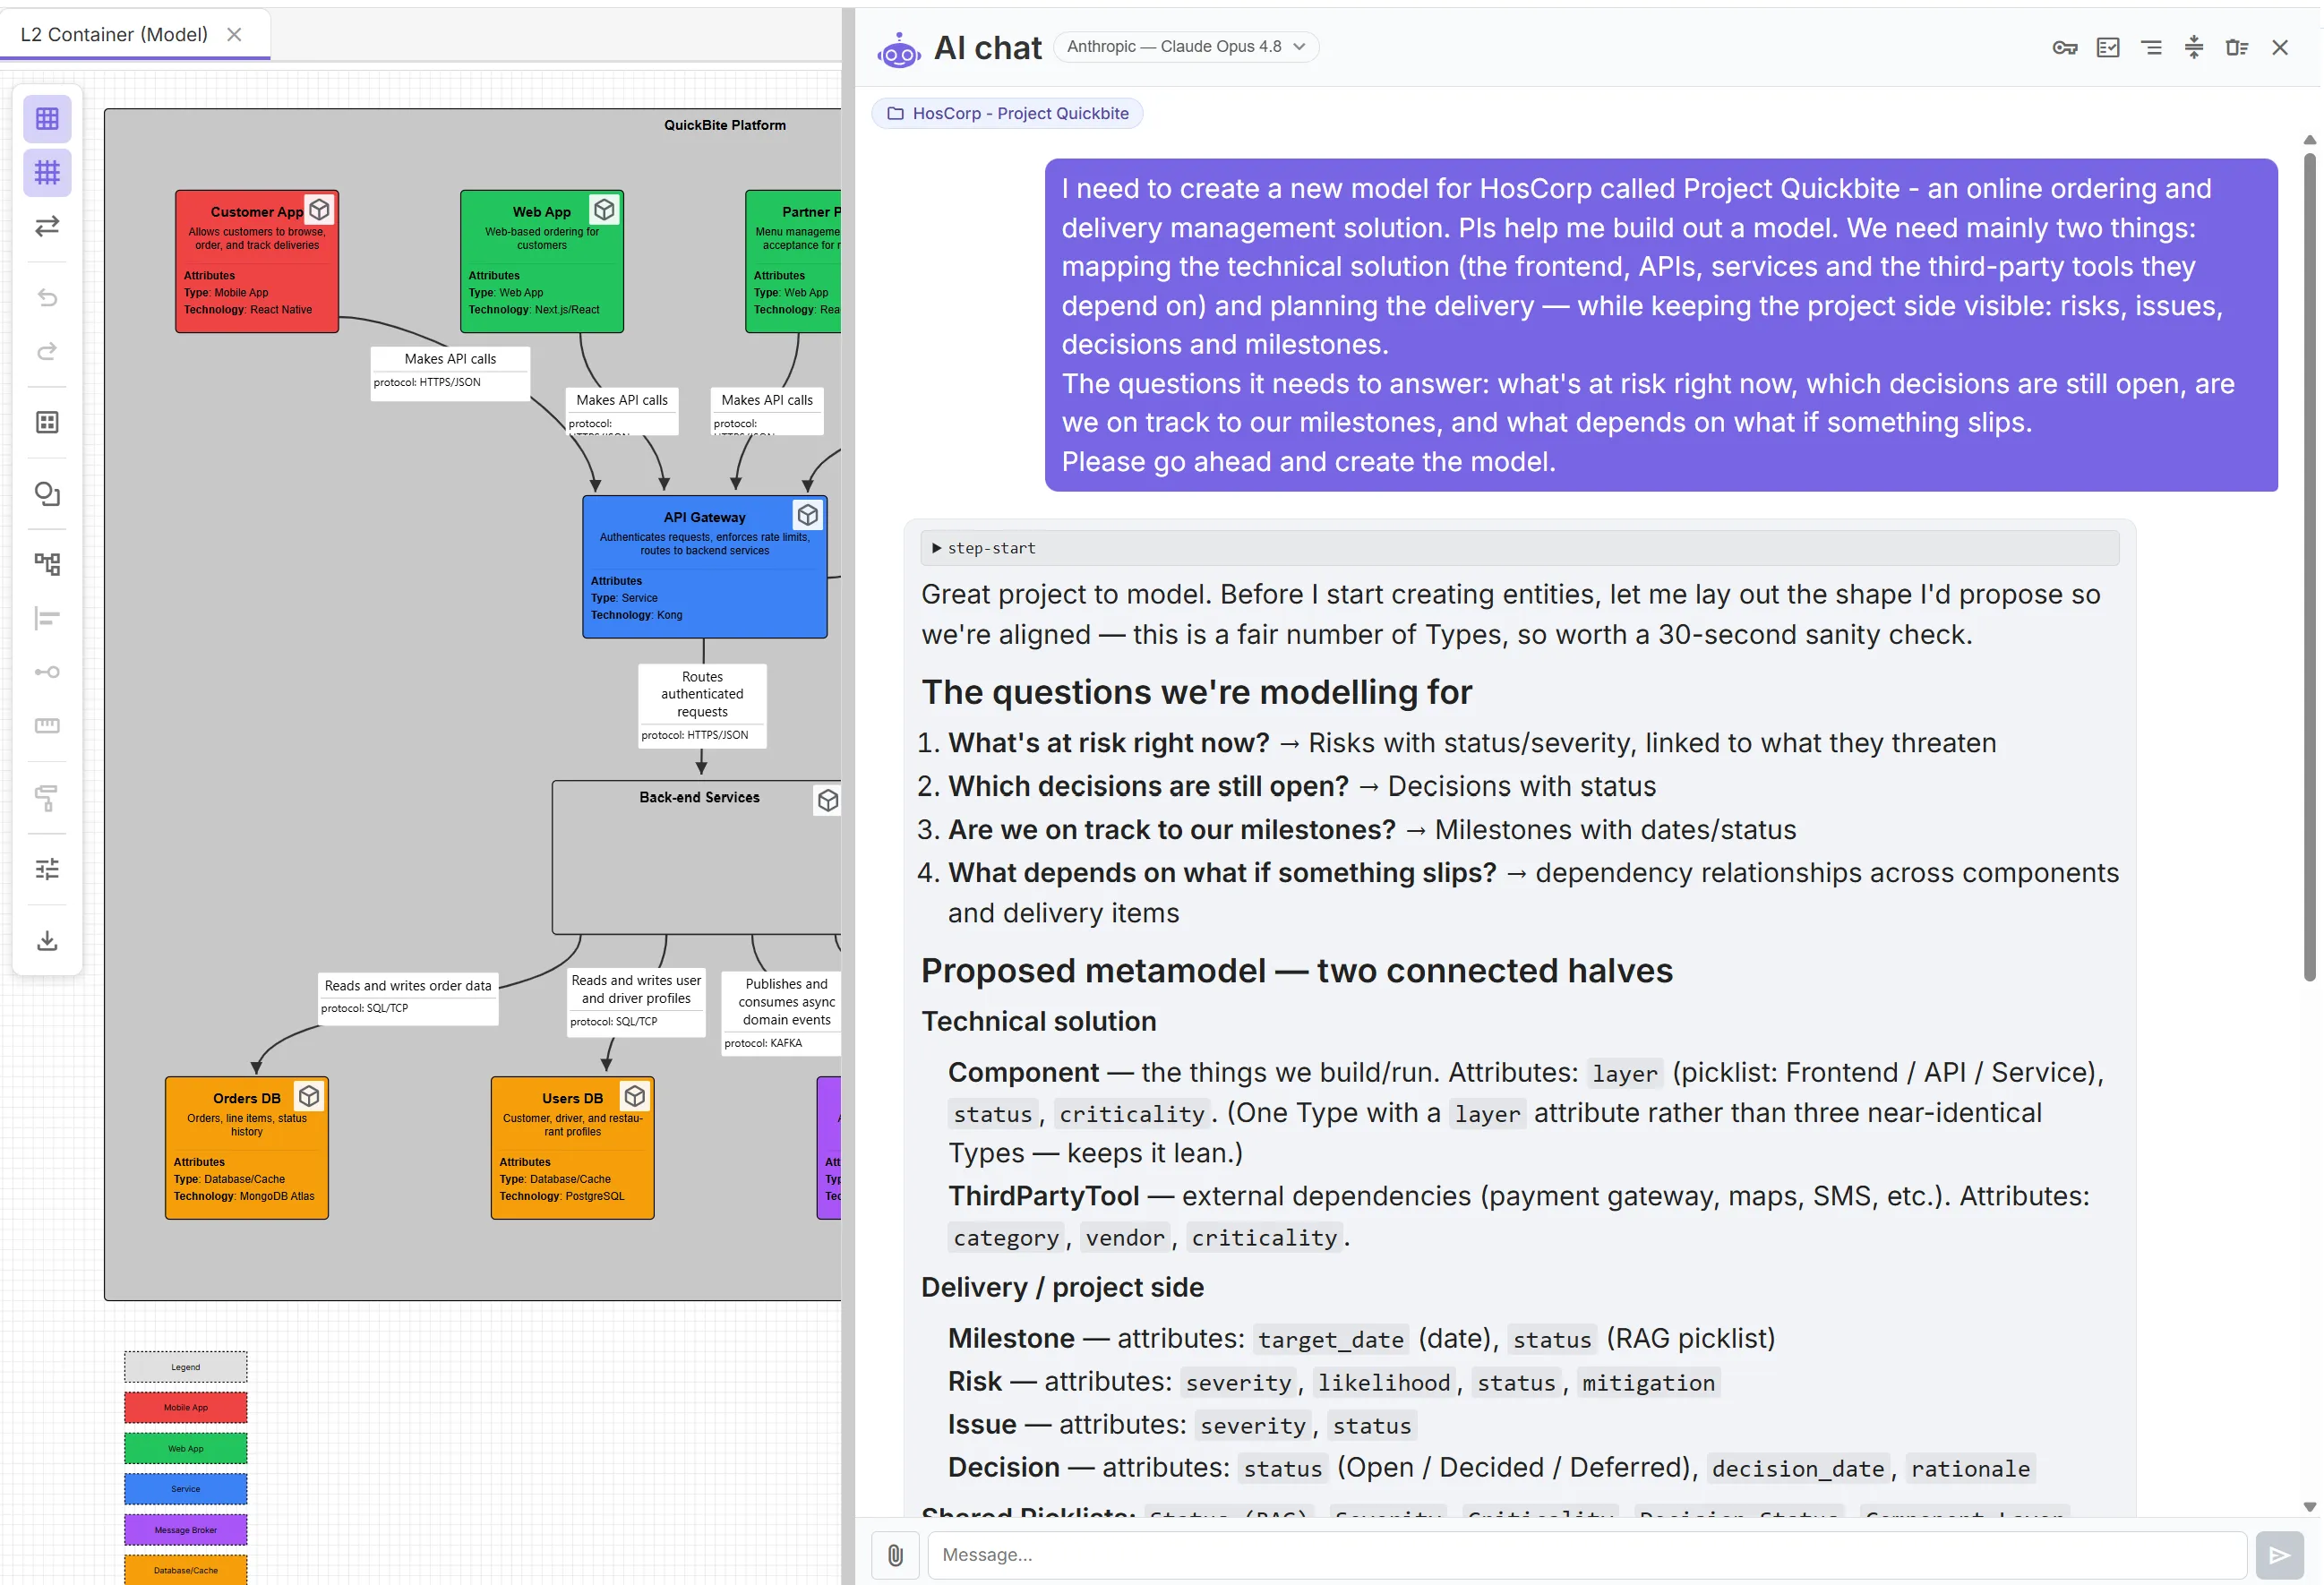
5. Co-model with AI
Let AI help build and evolve the model
Describe what you want in plain language — in Planalyze's built-in assistant, or from your own AI via Claude.ai or ChatGPT — and Planalyze proposes validated changes for you to approve. The model updates, and every view follows. People and AI work the same living model, through the same safe checks. (Beta · bring your own key.)
One model. Multiple ways to understand it.
Planalyze helps you define structure, capture reality, visualize relationships, and analyze what matters — all in one connected system.
See how Planalyze works in practice
Join the beta and start building a connected view of your architecture.